 Location Map Overview
Overview:
Location Map is a powerful application that allows you to manage and visualize your CyberAudit-Web data with an
augmented geographic map.
Location Map is integrated within CyberAudit-Web and available with the Maps and Location Graphics
Software Enhancement Module. For more information as to how to setup the Location Map, go to the Setup Guide
here.
What are the benefits of Location Map?
-
Visualize and display items on a map:
- Bring your CyberAudit-Web system to life by augmenting your data on a powerful geospatial map.
- Understand surrounding environments (eg available transportation, parking facilities, etc).
- View item location distributions across the world as aggregated cluster counts.
-
Make better business decisions:
- Gain insight and information from geospatial data to help your business succeed.
-
Improve transparency in employee engagement:
- Using the Audit Trail tool, you can add an additional level of confidence by presenting a user's events as they occurred in a step-by-step timeline.
- This helps us discover trends and insight that can make workflows more effective.
-
Find relevant items easily:
- Process and present information relevant to your workflow with the powerful Filter Tool.
-
Improve onboarding and training:
- Empower new users to learn and interact with the system efficiently.
-
Capture and export geo-coordinates for Geographic Information Systems (GIS):
- Create a layer of locks, doors, and communicators for GIS and other mapping services.
-
Answer questions such as:
- Where is this item located?
- Are there any facilities nearby?
- What does the building look like?
- How do I get there?
- What other items are nearby?
- How are users interacting with the item?
- Where should new items be installed?
|
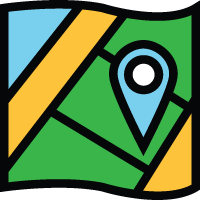
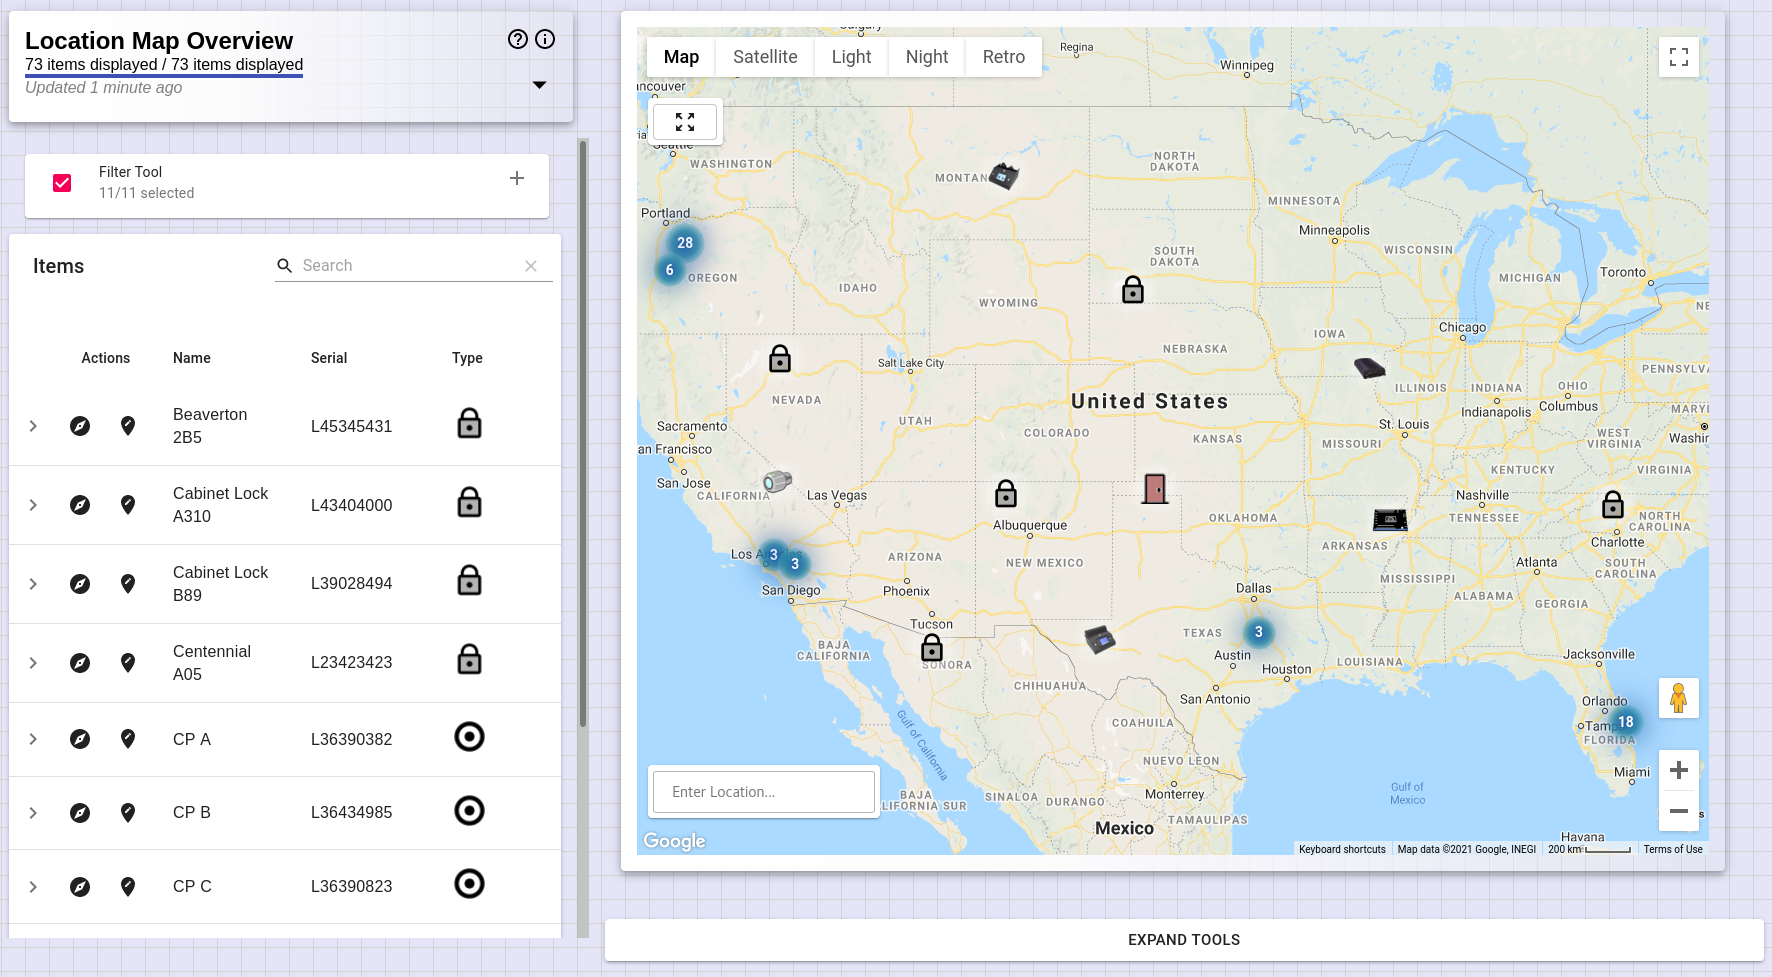
Map: Items visible to your account are rendered on this map. On the first time page load, the application will dynamically calculate the needed viewport to display all items in the system. |
||
|
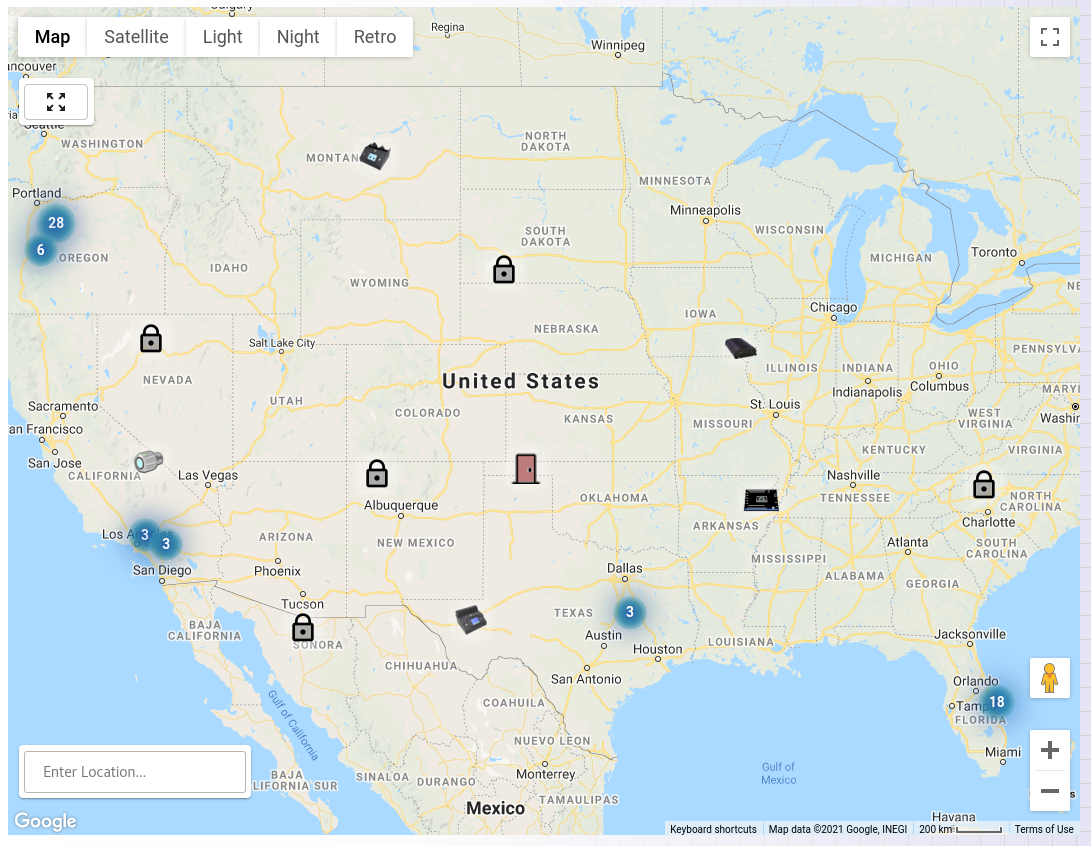
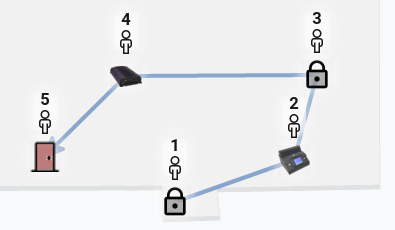
Markers: Items are displayed on the Map with markers. You can hover and interact with items by clicking on them. When you click on an item, it will automatically be selected in the Items Table. Different item types have different icons. |
||

|
Clusters: In order to improve performance, nearby items are merged into a single item for certain zoom levels. The number value in the middle of the cluster indicates the number of items being merged. As you change the zoom level, clusters on the map will update accordingly. |
||

|
Map Styles: The map style can be changed by clicking one of the options on the side. |
||

|
Show All Items Control: This button will zoom-out the window to display all actively visible items on the map. |
||

|
Full Screen Control: This button will open the map in Full Screen mode. Full Screen mode improves visibility of the map. |
||
|
Search Location Control: This control allows you to search for locations on the map. When using Google Maps, the Places API must be enabled in order for this control to work correctly. Please review the setup guide for more information. |
||

|
Street View Control: This button is used to enter into Street View. Click and drag the person to a position on the map. This control is only available for Google Maps. |
||

|
Zoom Control: These buttons allow the map to be zoomed in and out. Alternatively, you can Ctrl + Scroll Up and Down in order to change the zoom level. |
|
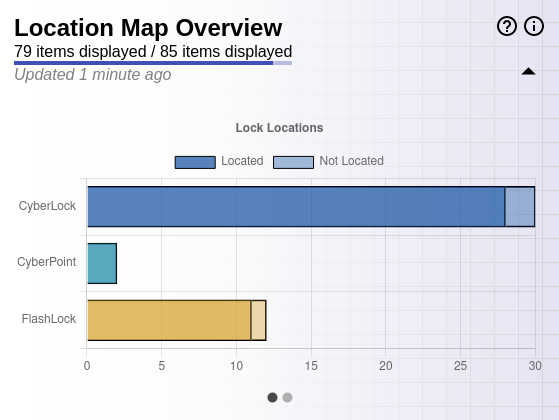
Overview Tool: The Overview Tool displays data charts and information about how many items are displayed on the map and are in the system. This data changes dynamically as filters are applied to the displayed items. |
||
|
|||
|
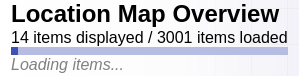
Loading: The bar in the top of the Overview indicates how many items are displayed on the map versus how many are loaded in the application. Filters affect which items are displayed. Items that don't have locations will appear in the items loaded, but not the items displayed. The bar will show a loading animation to indicate when data is being updated from the server to the application. The application can still be used, but the data will refresh itself after the update is completed. |
|||

|
Actions: There are two actions that can be performed for the Overview Tool to provide additional information. (i) Application Guide: This action will start a guided tour of the application, highlighting every component on the page. (?) Context Help: This action will open up the Context Help documentation for Location Map. |
||
|
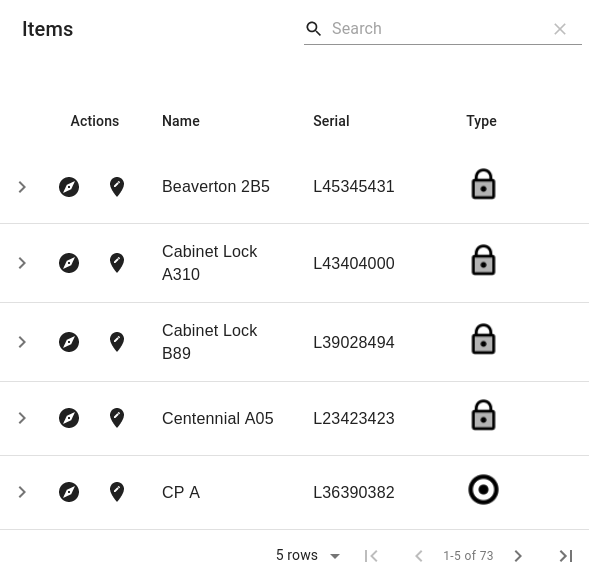
Items Table: The Items Table allows you to manage and interact with CyberAudit-Web items and the Location Map. |
||

|
Search: Search allows you to filter for specific items. You can search through any of its properties, such as 'Name', 'Serial', 'ID', and 'Type'. |
||
|
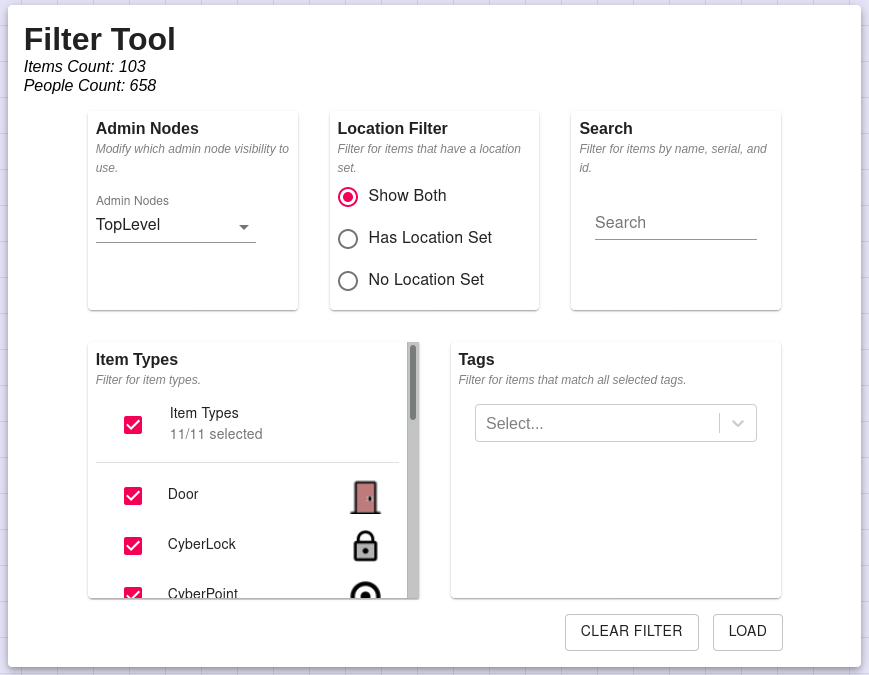
Filter Tool: The Filter Tool is used to filter items in the Items Table based on item type. You can use this tool to filter for locks, doors, and different communicator types. |

|
Actions: There are two actions on each row for a given item. More actions can be performed in the Detail Panel, but these actions directly interact with the Location Map. Navigate to Item: This action will zoom-in and center the selected item on the Map. If this action is grayed out, this means that the item is not on the map because it does not have a location set. Locate Item: This action opens up the Locator Tool, which is used to modify an item's location. If this action is grayed out, this means that the user does not have permission to update this item type. |
||
|
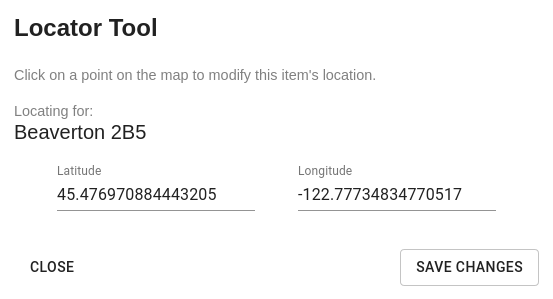
Locator Tool: The Locator Tool is used to modify an item's location. It is opened up using the 'Edit Item' action in the Items Table. The existing latitude and longitude values are displayed when it is first opened. If the item does not have a location, these values are set to 0. By clicking a point on the map, the latitude and longitude input values are modified. When the user clicks 'Save Changes', the item's location will be saved. The Map will automatically refresh after this. |
||
|
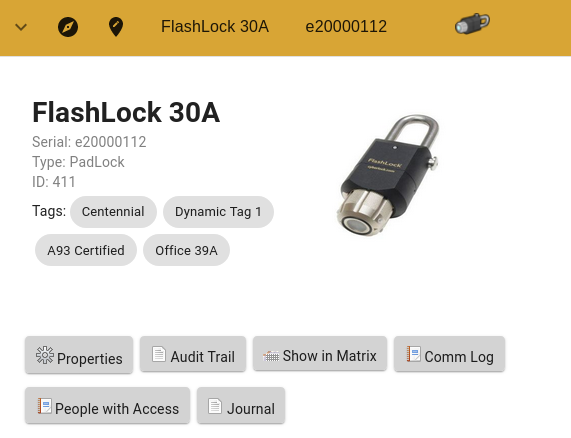
Display Panel: An item's display panel can be opened by clicking on the '>' icon or by clicking on the row. The Display Panel will have additional details for the item, including tags and the user-editable photo (if applicable). Additionally, item actions are found here, such as 'Properties' and 'Audit Trail'. Item actions are different for every item type and some are only displayed if the user has permissions for that action. Item actions will open up a popup window. In some cases, like 'Properties' or 'Caching', the popup window will close automatically and the Location Map will refresh. |
|
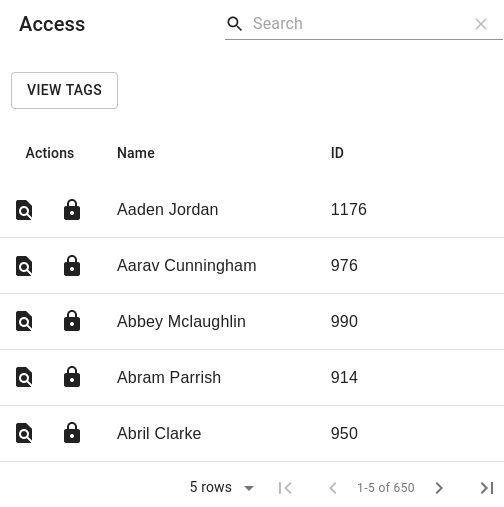
Access Table: The Access Table allows you to interact with the map using data from people and people tags. |
||
|
|
Search: Search allows you to filter for specific people or people tags. |
||
|
View Tags: Selecting the 'View Tags' button will change the Access Table to view tags instead. This can be toggled between tags and people. |
||

|
Actions: There are two actions on each row for a given item. These actions interact directly with the Location Map. Audit Recent Events: Selecting this action for a row will open up the Audit Trail tool. Please see the section below for more information. Filter Accessible Items: Selecting this action for a row will filter all displayed items on the map and on the Items Table for items that this person or person tag can access. Selecting another row or tapping the ‘x’ button on the filtered display icon will clear the filter. |
||
|
Audit Trail Tool: The Audit Trail Tool is used to review a given person’s recorded events for a user-given date span. Selecting the ‘Audit Recent Events’ action on a person’s row will open up the tool. Each event is displayed in a chronological timeline. Selecting an event on the timeline will refocus and navigate the Map to the event’s associated item. Additional details about the event are also provided. The date span and maximum number of events to retrieve can be configured in the Settings tool. |
|
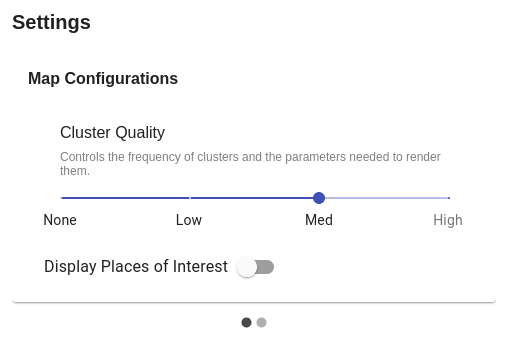
Map Configurations: Cluster Quality: This value controls the frequency of clusters and the parameters needed to render them. Increasing the quality will increase the frequency and radius for clusters. Display Places of Interest: This value toggles whether or not to display places of interest on the Map. Places of interest are restaurants, attractions, businesses, etc. |
||
|
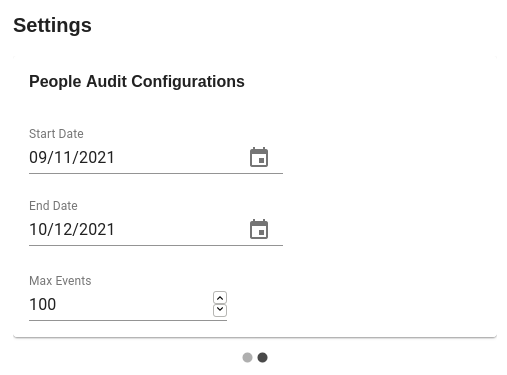
People Audit Configurations: This page has settings that modify the results of the ‘Audit Recent Events’ action. The start date and end date of the date span can be modified in addition to the maximum number of events to retrieve. |
Misc information:
- Auto Refresh: The Location Map application will automatically refresh its data after a designated time and if no other request is being made.
- Permissions: Permissions for the current user are used to determine what data and which actions they can perform. For example, if the user doesn't have permissions to view Doors, then Doors will not be displayed on the application.
Additional links
|
Location Map Overview Setup Guide Commonly Asked Questions |
Audit Recent Events Update Item Locations Filter Tool |
