 Server Logs
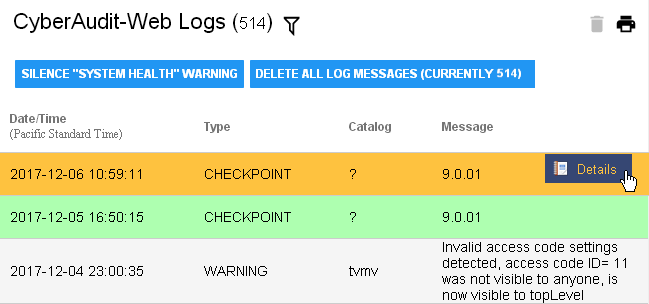
CyberAudit-Web logs messages and errors to the global database for viewing. These logs enable monitoring and troubleshooting by the CyberAudit-Web system administrator.
|
|
|
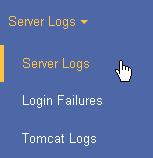
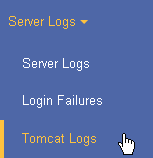
CyberAudit-Web logs are accessible from the Server Logs menu in the Manage section. Click on a record and then click Details from the menu to bring up a stack trace to provide for support on an issue. |
Two buttons are available for CyberAudit-Web logs.
|
|
A filter is available to
reduce the list of logs based on these criteria:
|
|
|
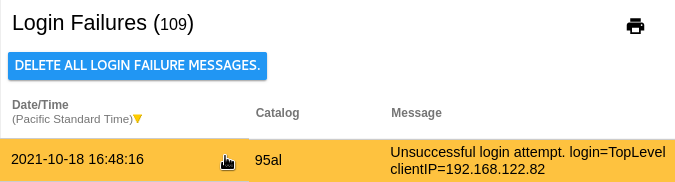
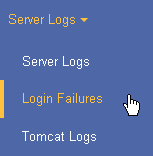
CyberAudit-Web logs any login failures. The account and login are displayed as well as
the date and time of the failure and the source IP. These logs are informational only, not needed for normal operations. They may be deleted by clicking DELETE ALL LOGIN FAILURE MESSAGES. |
|
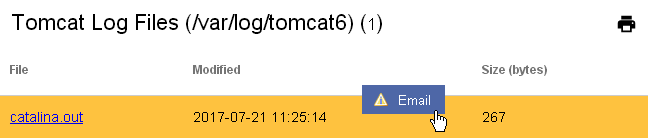
Tomcat is the application that runs CyberAudit-Web. It logs its output to the catalina.out text file. This file can be another source for troubleshooting. Once per week the catalina file is compressed using gzip and a new catalina.out file is created. The archived gzipped catalina.out files may also be viewed or emailed. |
